
 By
·
4 minute read
By
·
4 minute read
Running a sustainable and profitable therapy practice requires more than providing excellent care—it’s about making informed financial decisions that keep your business thriving. At PracticeVital, we understand that revenue management can be complicated and time-consuming, and challenging to make sense of in your EHR. Our two new revenue reports (currently in beta), attempt to simplify revenue with clear visuals, easy comparisons, and up-to-date averages that will aid in current and future financial exercises for your practice.
Here are a few ways I’m leaning on my PracticeVital revenue reports within my own practice.
Track quarter over quarter, year over year trends
Tracking revenue over time is essential for me to understand long-term growth and identify patterns. Are certain seasons or months consistently stronger than others? Are we growing year over year? PracticeVital lets me easily compare revenue across different time periods—whether it’s by quarter, month, or year—giving me a clear view of trends I can rely on. This data is invaluable for planning my budget, predicting slow or busy periods, and ensuring my practice continues to grow steadily.
Optimize my practice’s overall financial health
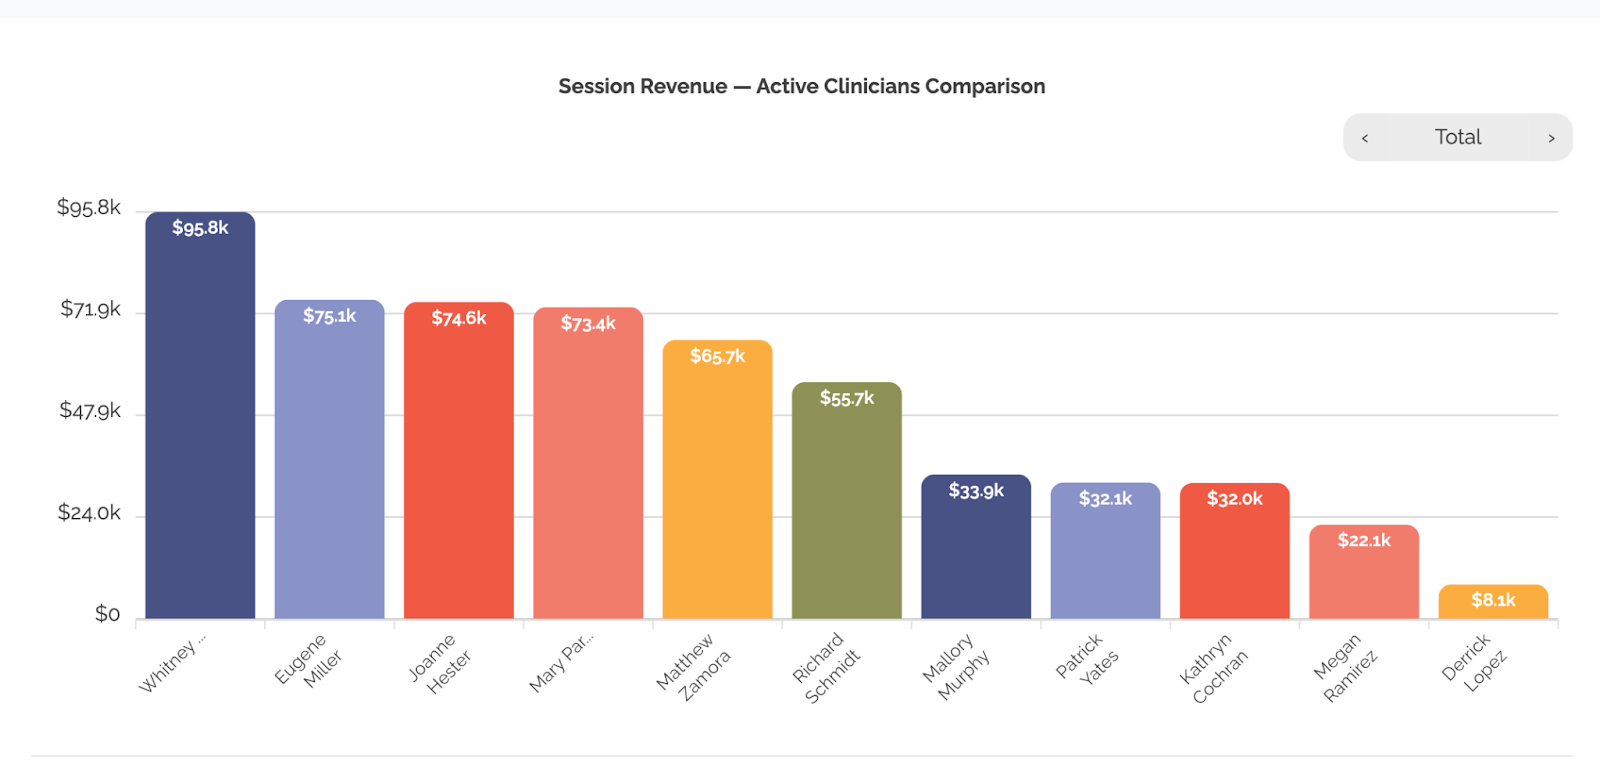
Having access to data like the Session Revenue – Clinician Comparison is crucial for understanding how each therapist is contributing to my practice’s financial success. This data allows me to clearly see which clinicians are generating the most revenue, helping me allocate resources, adjust caseloads, and offer incentives more effectively.
Let’s consider an example. In the report below, one full-time therapist, Whitney, is bringing in $95.8k, which is roughly the same as four part-time therapists combined. This practice may want to consider the costs of having part time employees and whether or not it’s more cost effective to hire only full time clinicians instead.
Monitor session payments, without the tedious spreadsheets
Without a clear view of which payments have been received, it can be difficult to know if you’ve been paid for every session. This can lead to missed revenue and wasted time trying to figure out if there are any missing payments. With PracticeVital, the Data Sheets tab allows you to view all appointments, with a column for revenue collected. I can filter to different time frames, attendance or types of sessions to quickly see which appointments are missing payments or only have partial payments. No more guesswork or digging through complex spreadsheets to find those answers.
In many EHRs, revenue for each session is separated by the date payments are collected, making it hard to get a full picture without downloading reports and doing spreadsheet gymnastics. PracticeVital eliminates this headache by displaying the total amount collected for each appointment in one clear view. No need for pivot tables or extra steps—just actionable data, ready when I need it.
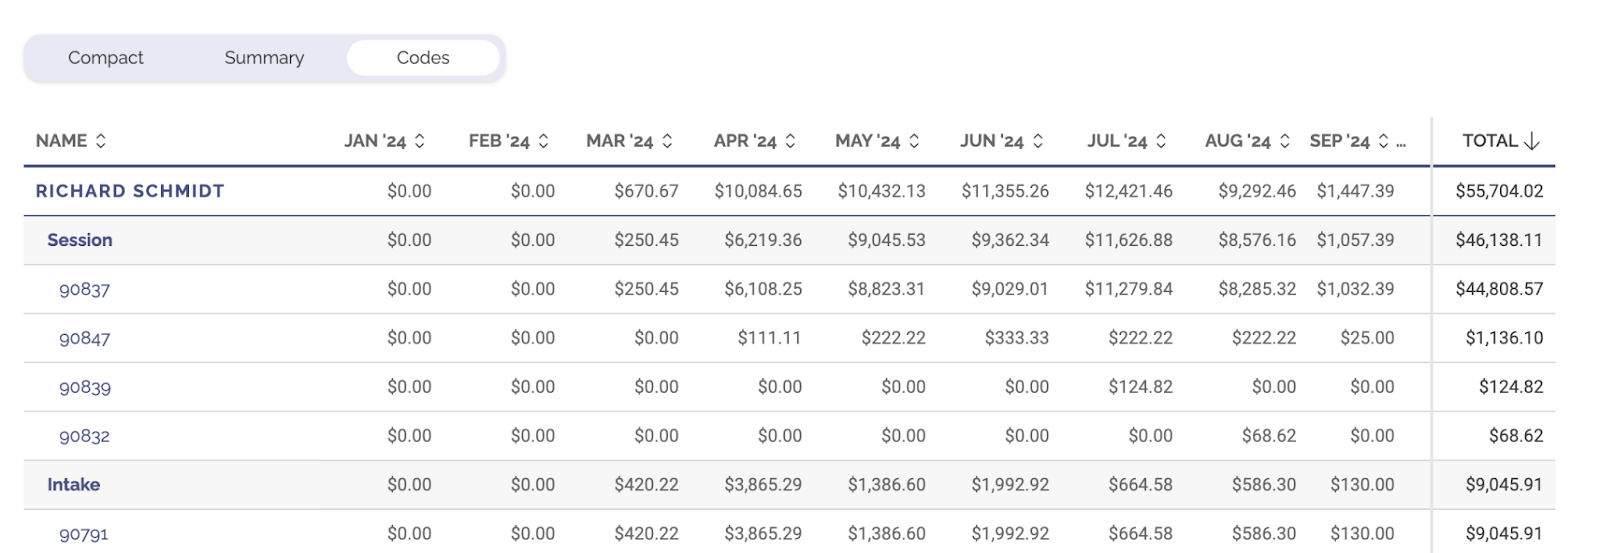
Understand which services and codes drive the most (or least) revenue
It’s important for me to know which services are contributing the most (or least) revenue to my practice to make smart choices on where to invest more resources and marketing, and which services to lean into or discontinue. With PracticeVital, I can quickly see which bill codes are contributing the most to my revenue. For instance, I wasn’t sure if our DBT groups were generating enough revenue, but once I could see the revenue at a glance, I could make a few additional quick calculations to decide whether they were worth continuing. I was also able to determine how much to compensate the group leader based on the average revenue per session. I use this data to decide which services to lean into or cut back on.
I’ve also found revenue inefficiencies in the types of codes my clinicians are frequently billing. For example, too many 90834s (45-minute therapy sessions) could reduce a practice’s profitability compared to longer sessions. With PracticeVital, I can monitor how often clinicians are billing each code and make informed decisions about how to optimize our sessions for maximum financial benefit.
Ensure your compensation model is fair, sustainable, and balanced
Tracking average revenue per session by therapist provides valuable insights into the financial health of both your practice and your clinicians. If you pay your therapists a percentage split, it’s important to ensure they have a balanced caseload of insurance payers. For example, if one therapist is consistently seeing clients from lower-paying insurance plans, their overall compensation will be negatively impacted, which could lead to job dissatisfaction.
By monitoring average revenue per session, I can work to balance caseloads and ensure therapists are seeing clients from a variety of insurance payers or private payers. This data also helps me identify discrepancies—such as one therapist consistently earning less per session—and allows me to adjust which clients we’re assigning to particular therapists or through other adjustments.
Re-interpret revenue trends by date of service, not date of payment
Most EHRs display revenue based on when the payment was received, which can delay or skew your financial reporting. This makes it hard to assess how my practice is actually performing during specific periods. PracticeVital solves this problem by displaying revenue based on the date of service, giving me a clearer, more accurate picture of my practice’s financial health. This allows me to make more time-based decisions without being misled by delayed payments from insurance or clients.
Additionally, if your practice compensates therapists with a flat hourly rate, it’s critical to understand each therapist’s average revenue per session. If you find that some therapists consistently bring in lower average revenue, you might need to reassess whether the flat hourly rate is sustainable or equitable for your practice. In some cases, therapists working with lower-paying clients may not generate enough revenue to justify their hourly rate, leading to financial strain on the practice. On the other hand, knowing which therapists consistently perform above average can help you establish higher, more competitive hourly rates for top performers, rewarding them for their contributions and keeping your compensation structure aligned with your practice’s profitability.
With a clear understanding of average revenue per session, you can ensure your compensation model—whether a percentage split or flat hourly rate—is fair, sustainable, and reflective of your therapists' performance.
How Comparing Revenue Can Help You Spot Opportunities and Cut Costs
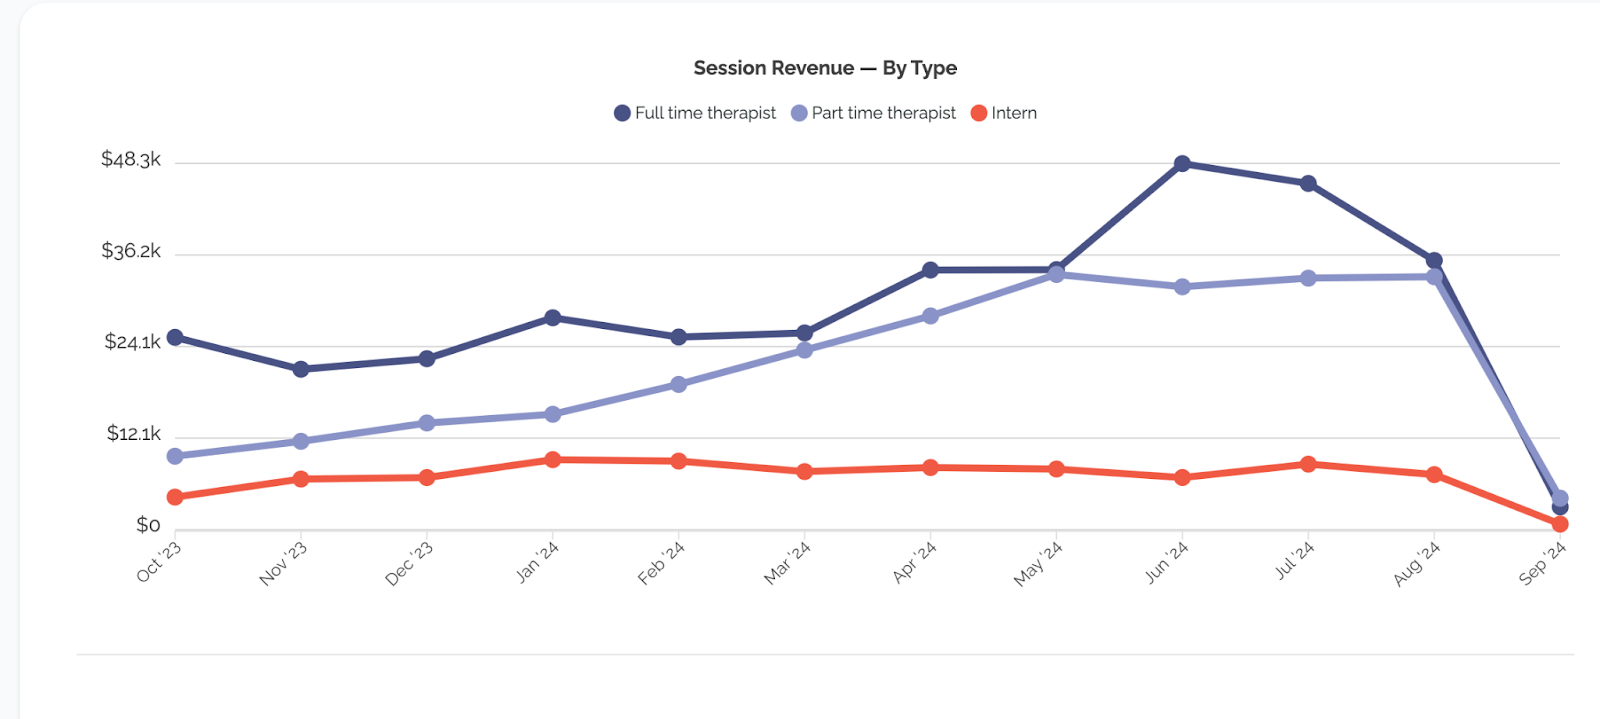
Comparing revenue across different groups of therapists (e.g. interns vs. provisionally licensed vs. fully licensed) or across locations is critical for understanding which aspects of your practice are driving revenue and which might be draining resources. For example, in the image below, the revenue generated by interns is significantly lower than that of full-time and part-time therapists. After you compare to expenses, this might indicate that the practice is losing money by investing too much in interns without seeing enough return. This data-driven approach to decision making helps ensure your practice remains financially healthy and sustainable.
Simplify, Strategize, and Succeed
PracticeVital’s revenue reports are designed to provide therapy practices with the revenue clarity they need to thrive. Whether it’s identifying unpaid sessions, tracking total revenue, evaluating the strength of specific services, or optimizing code usage, the automated metrics help take the guesswork out of my practice’s revenue.
With this actionable data at my fingertips, I can make smarter, faster, and more strategic decisions to boost my practice’s success.